ATTRIBUTE
Web Design
TYPE:
Corporate Project
YEAR:
2023
KEY WORDS:
#UsabilityTest #DataDrivenDesign #Web

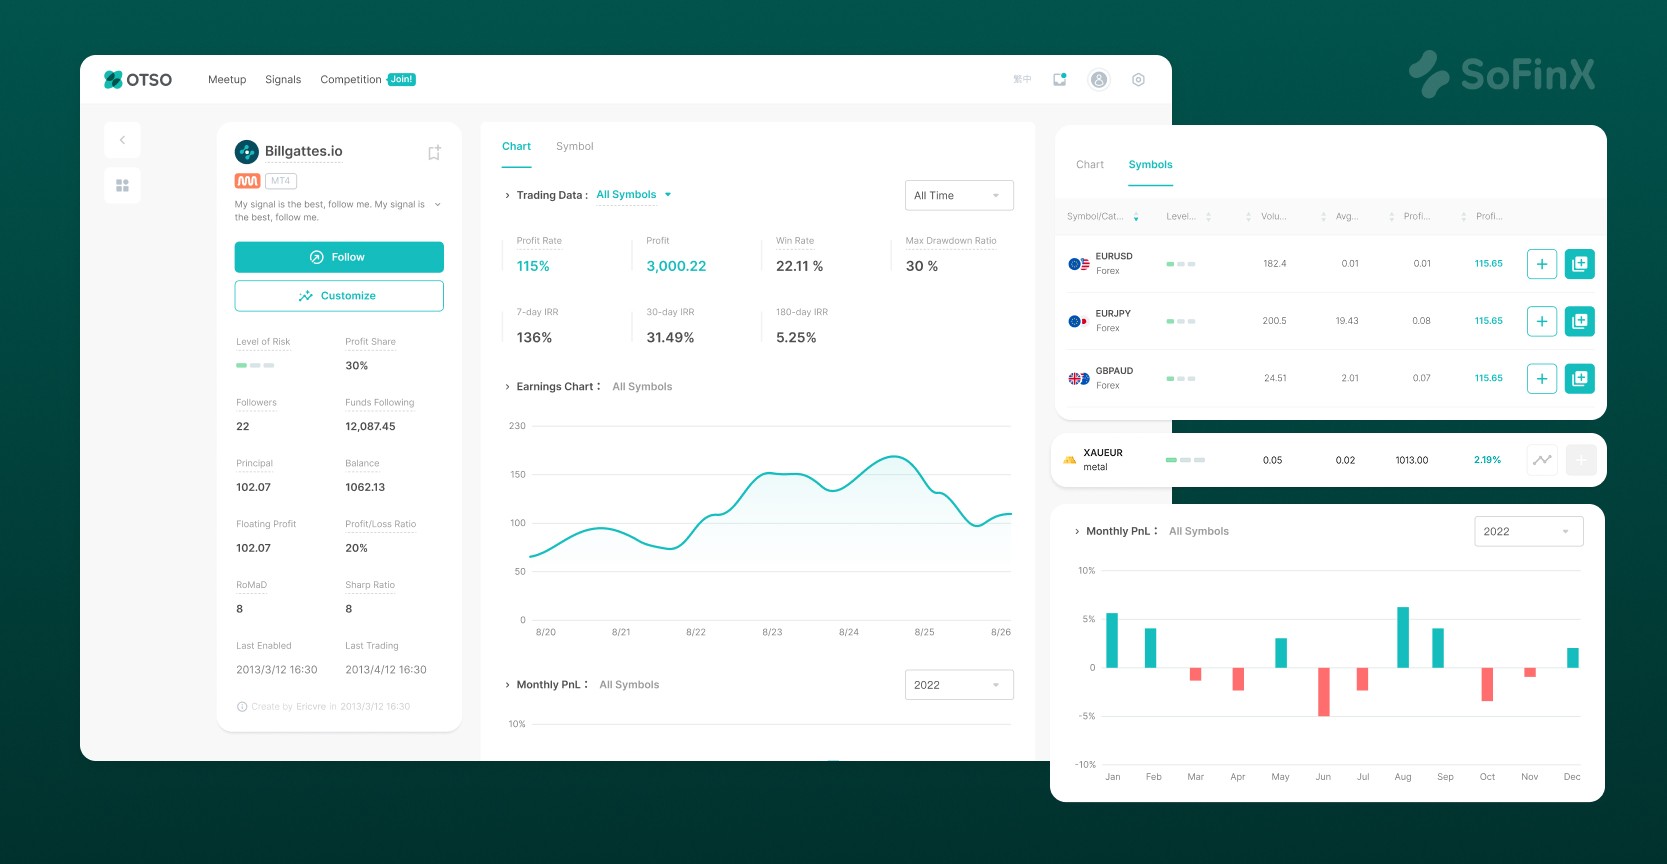
Redesigning the Signal Panel to Boost User Follow Rate
SoFinX provides a diverse portfolio of trading signals from professional traders, enabling investors to follow and enhance their trading performance. However, the original signal panel presented information in a confusing way, which undermined investor trust and made strategy selection difficult and resulting in low follow rates.
To solve this, I restructured the data hierarchy and emphasized key credibility metrics, creating a clearer and more intuitive user experience. This redesign led to a 36% increase in Follow Conversion Rate, directly contributing to the platform’s business growth.
My Role
As the Lead UX Designer, I led the strategic redesign of a high-stakes financial feature. I initiated the project through usability testing and data analysis, translating key insights into measurable design improvements. I redefined the information architecture for complex financial data to enhance the platform’s overall user experience, and collaborated closely with Engineering and Product Management to ensure both technical feasibility and strategic alignment.
challenge.
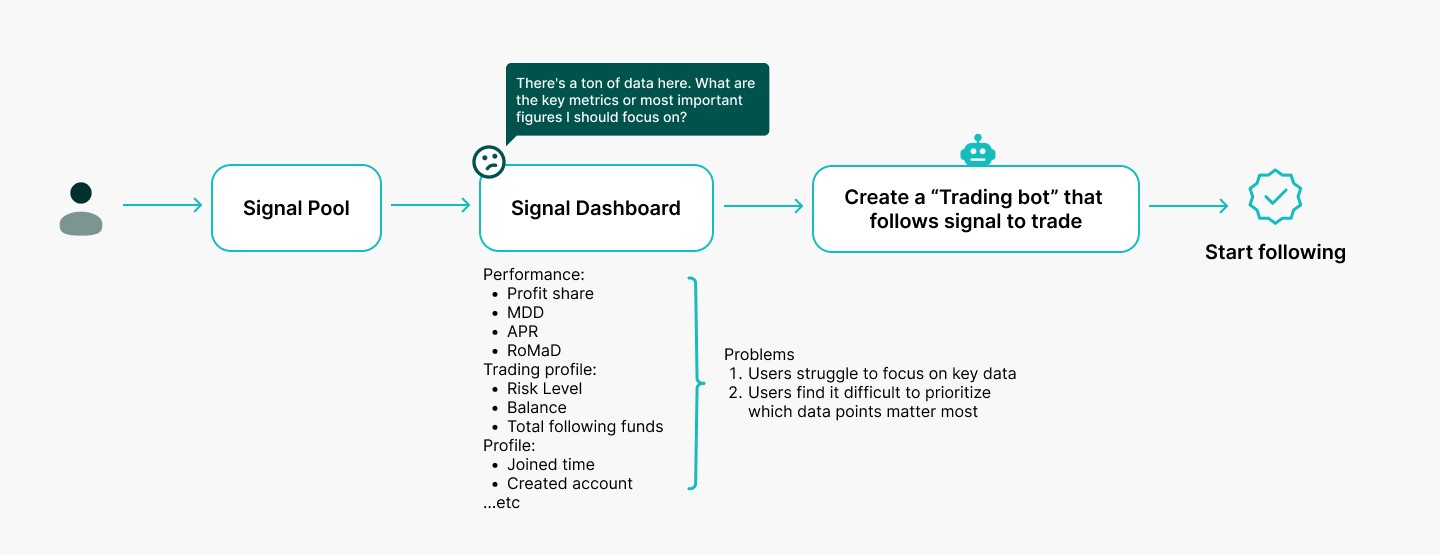
User Problem
Users struggled to identify key information needed for investment decisions due to information overload and a lack of visual hierarchy. This resulted in confusion and high drop-off rates on the trading data dashboard.
How might we help users intuitively find signals that fit their investment style through clearer data hierarchy and simplified information design?
Business Goal
Complex information and unintuitive interfaces reduce users' willingness to start copy trading, directly impacting overall product revenue. This redesign aimed to simplify the interface to improve user engagement and reduce drop-off rate.
design outcomes.
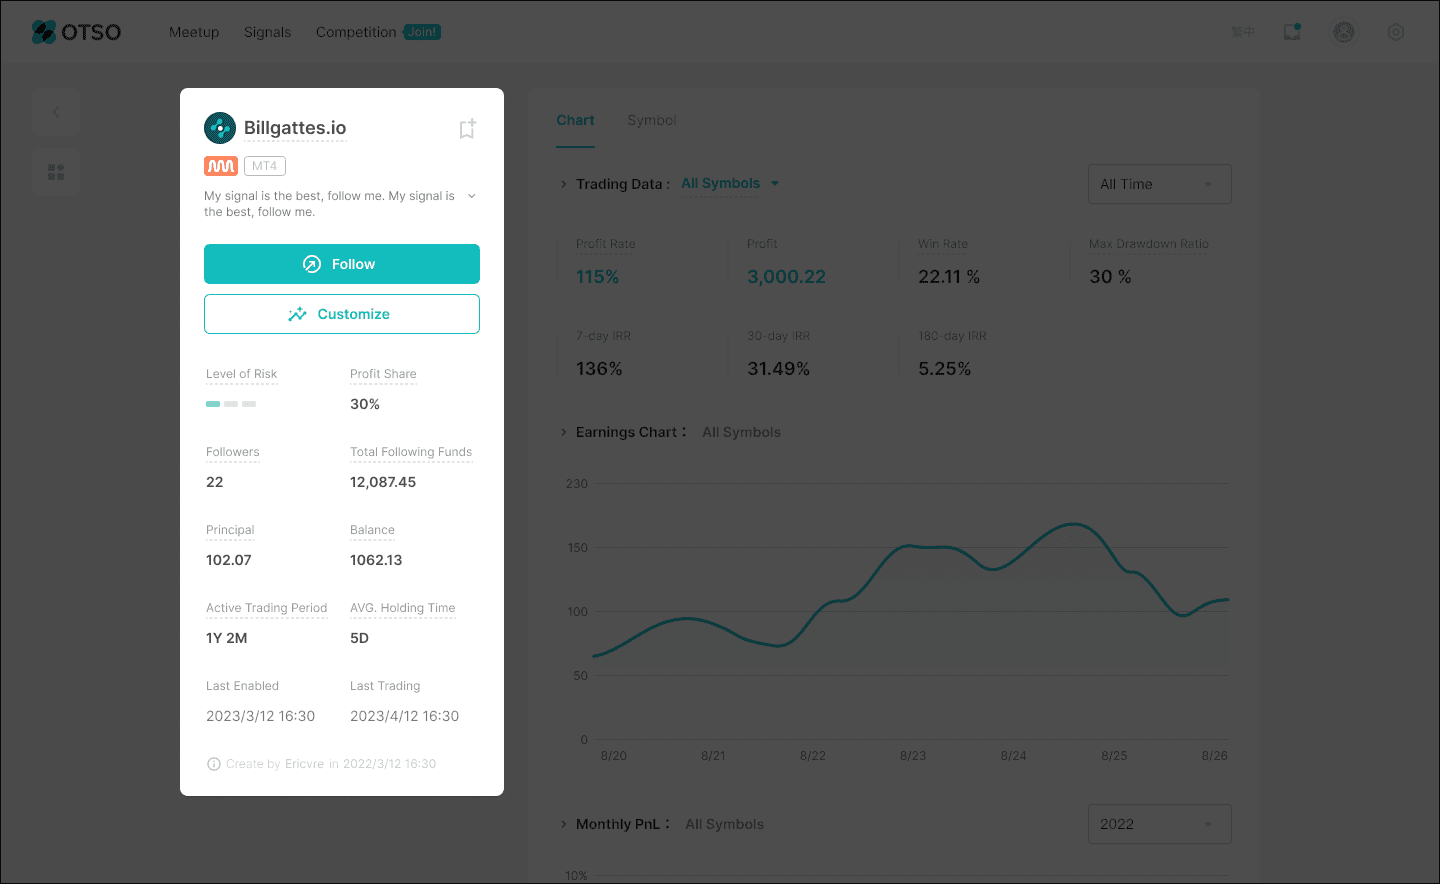
1 | Structuring Data: Organizing Signal Source Fundamentals and Risk (Left Panel)
Implemented a left panel to logically classify and centralize the signal source’s profile and risk
Left panel contains static credit indicators (e.g., creator profile, creation time, total invested/followed capital) and the overall risk rating. This structural separation clearly segments the foundation of trust data from dynamic performance metrics.
By creating this clear distinction and zoning, users can efficiently complete their background due diligence before reviewing performance, ensuring decisions are grounded in an independent and adequate assessment of credit and risk.
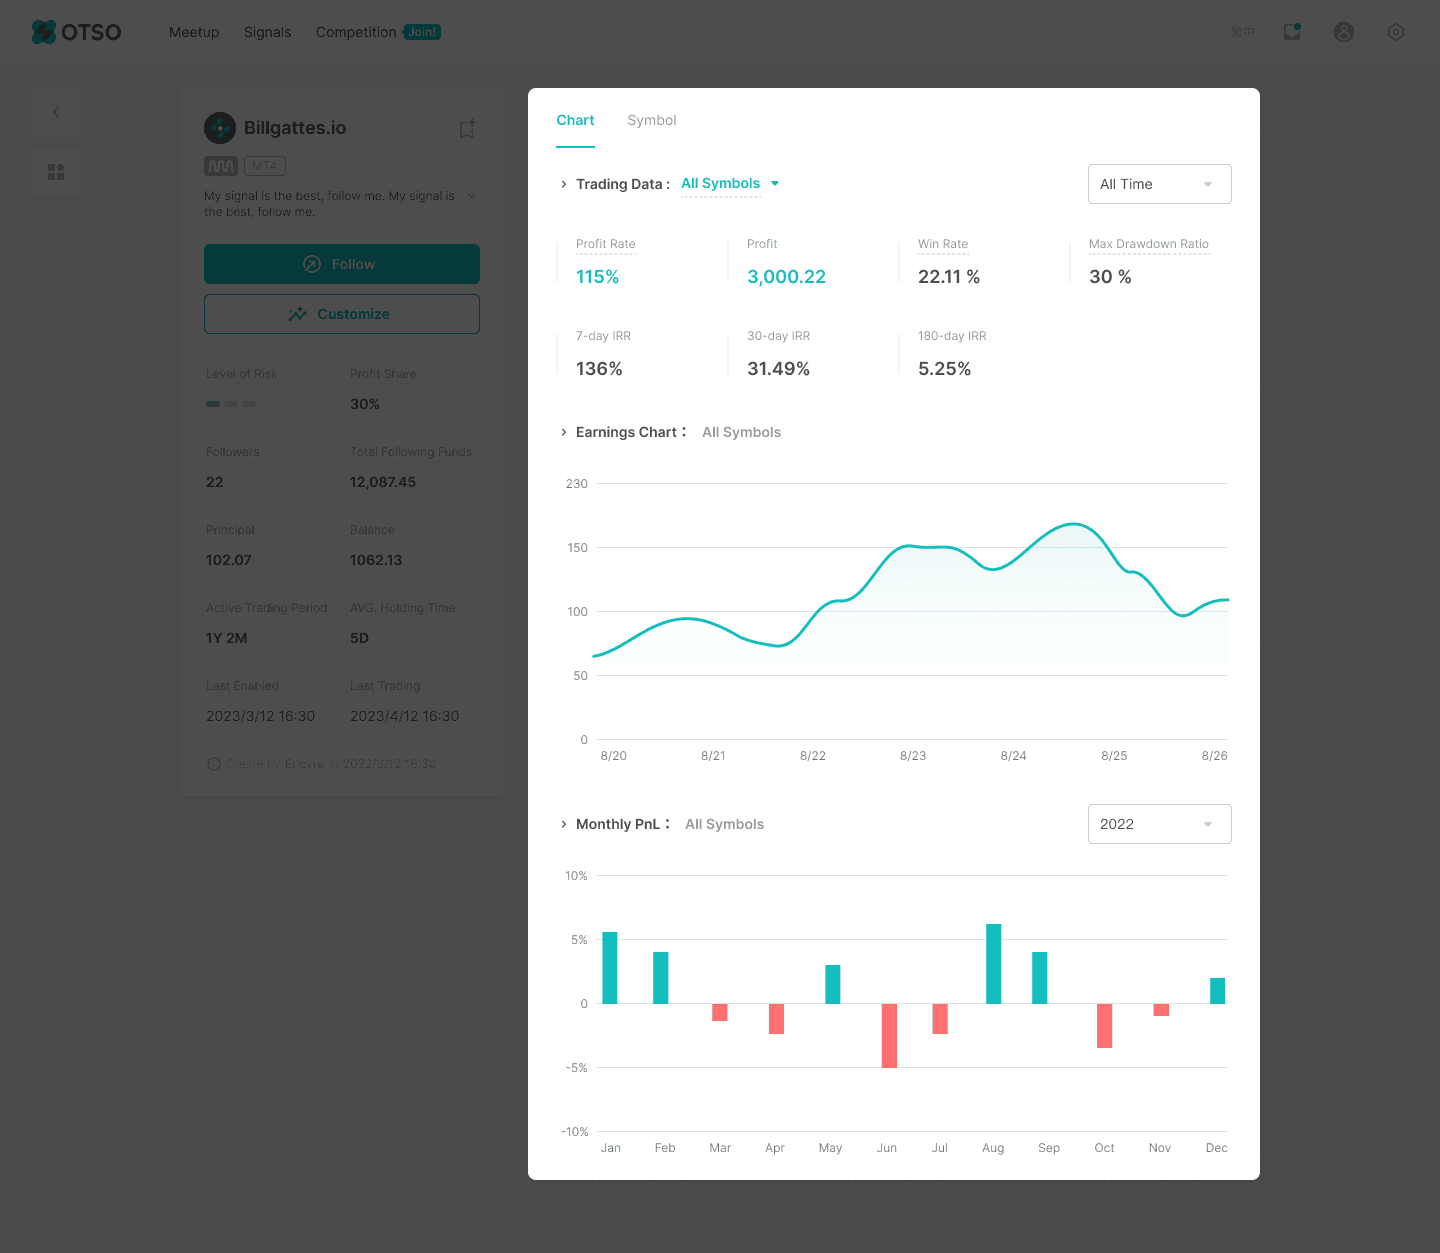
2 | Trading Data Panel: Prioritizing the Performance Data (Right Panel)
To prioritize critical trading performance data and added the timeline-based chart visualization to enable users to easily compare historical trading data and identify trends.
Emphasized the "Profit Rate" using UI color-coding (green for positive performance and red for negative performance) to facilitate instant risk assessment.
Integrated a dynamic chart visualization combining interactive line and bar graphs to clearly represent historical performance trends and support quick, actionable decision-making.
3 | Symbol Isolation: Enabling Data-Driven Robot Selection
Integrated symbol-specific tabs within the right panel to allow users to isolate and analyze the detailed performance data of individual trading symbols.
This design creates an efficient workflow, directly supporting users in identifying and comparing high-performing symbols based on historical metrics. The process of selecting symbols for integration into users’ customized trading robots to enhance algorithmic strategy development.

impact.
Successfully led the cross-functional design and delivery of a streamlined Social Trading Data Panel, resulting in a 20% user drop-off. By enhancing data clarity and performance visualization, I also achieved a 15% increase in signal source sign-ups, validating the effectiveness of the new information architecture through usability testing and close collaboration with Product Managers and Engineers.
Viola is not just a colleague but also a trusted partner whose work consistently instills confidence in those around her. Her combination of professionalism, creativity, and reliability is truly rare.

Edison Duan
Founder & CEO

